An average wrinkle score answers a group question. It does not immediately tell us how many people improved, how much their experiences varied, or whether the difference mattered to them. Those questions need different information, even when they start from the same set of observations.
This article separates those questions through an explicitly invented example and a close reading of how a study estimate is constructed. The aim is to make the numbers more useful: identify what was measured, preserve the comparison, and recognize where a numerical result needs additional evidence before it becomes a personal expectation.
Study figure and data
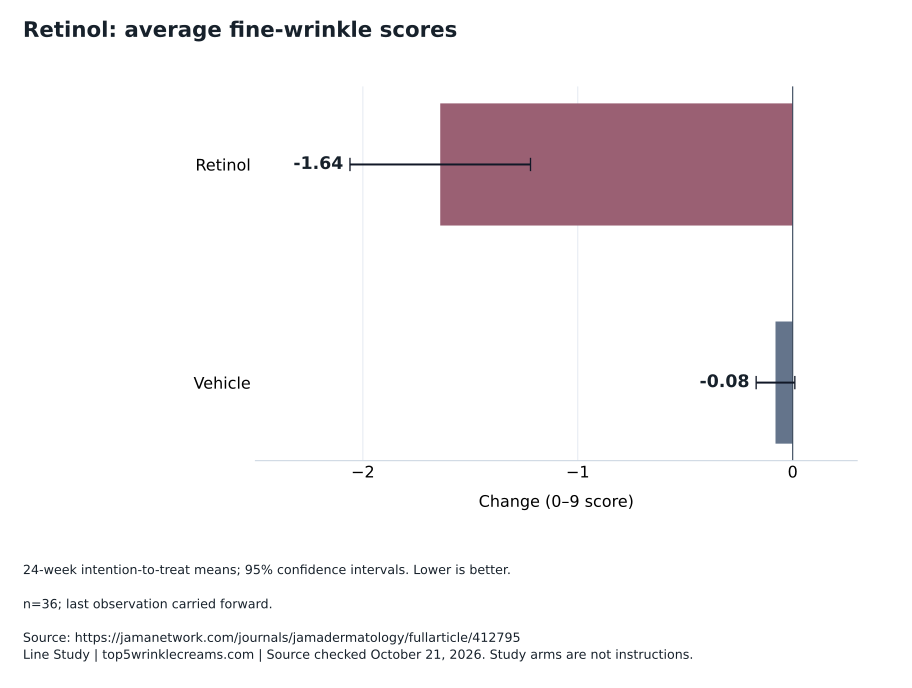
Retinol: average fine-wrinkle scores
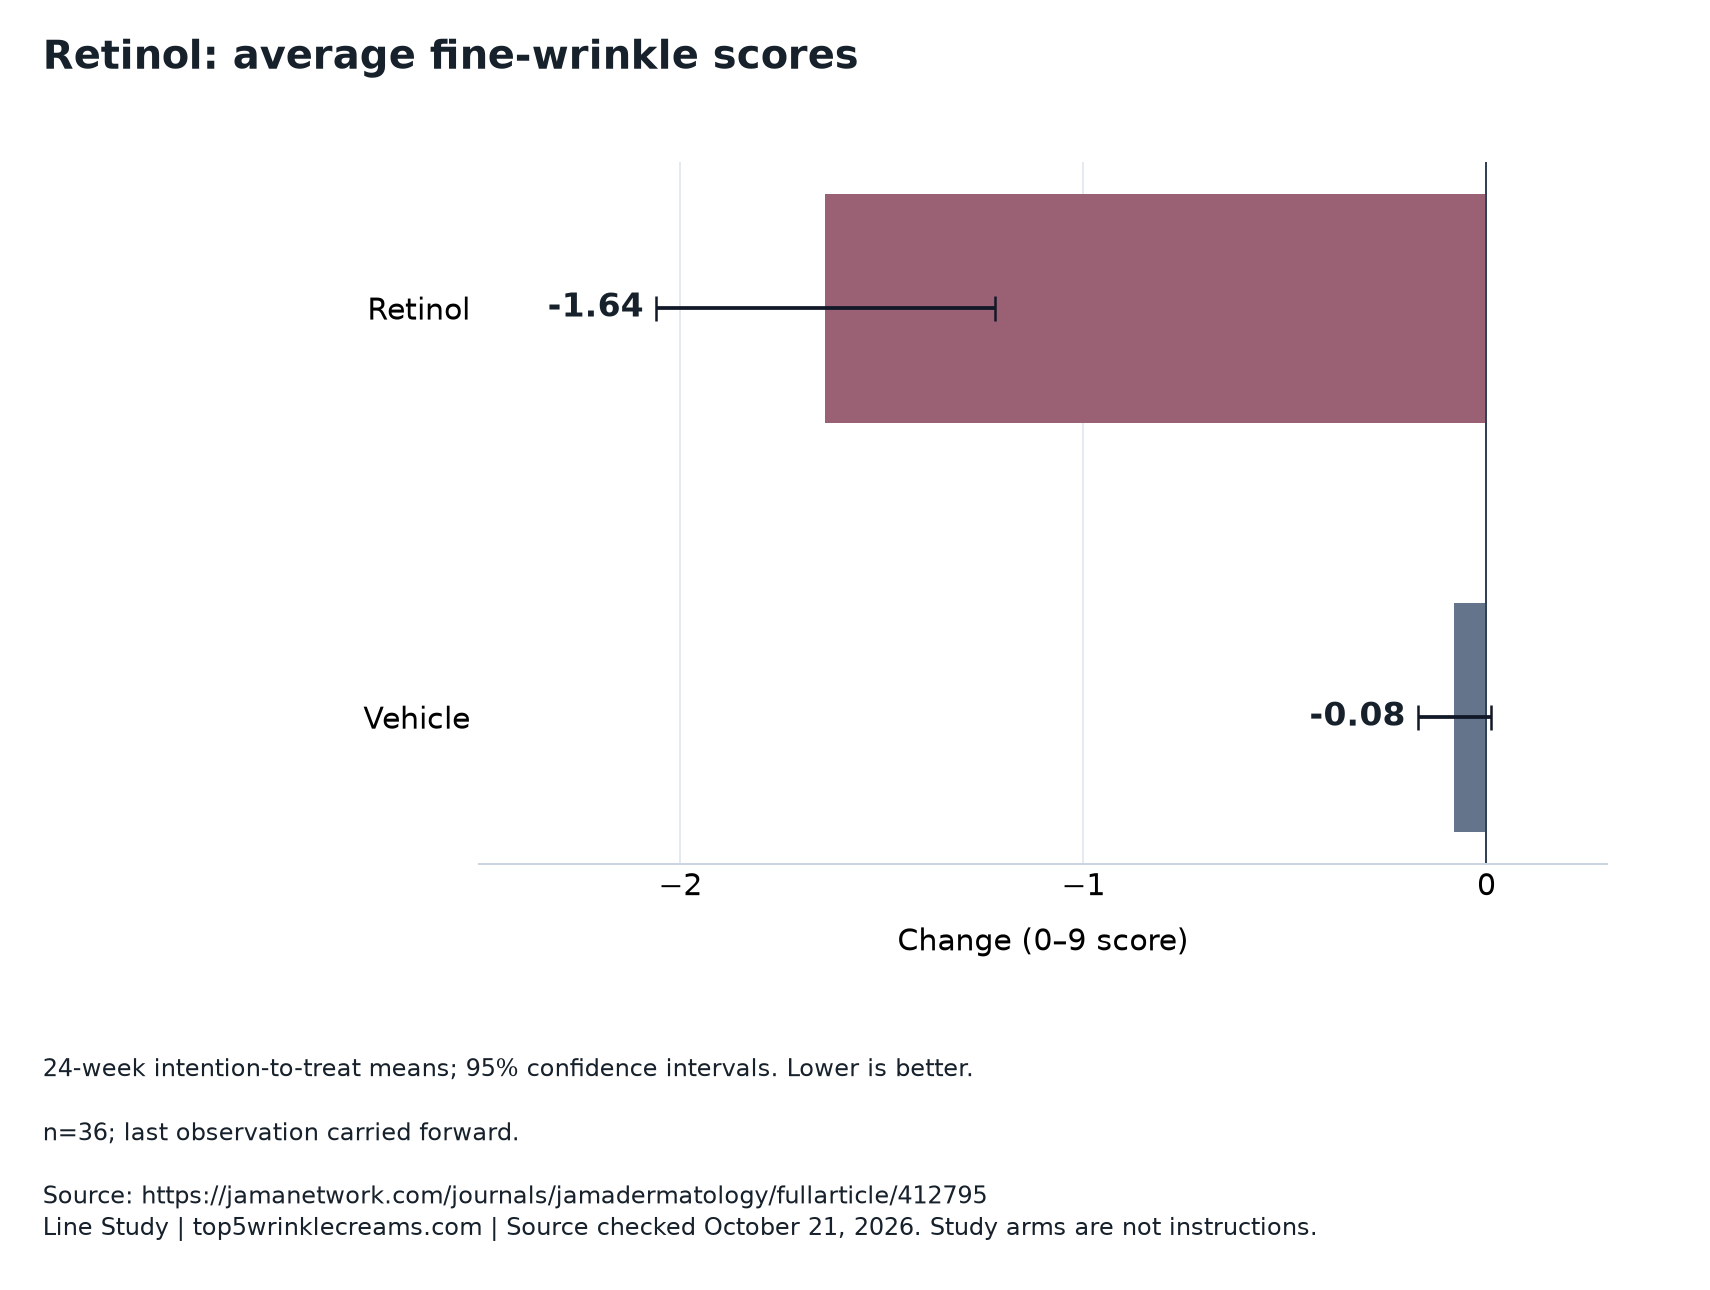
24-week intention-to-treat means; 95% confidence intervals. Lower is better.
n=36; last observation carried forward.
Download chart (PNG)Download data (CSV)Download vector chart (SVG)
| Study arm | Reported value | 95% confidence interval |
|---|---|---|
| Retinol | -1.64 | -2.06 to -1.22 |
| Vehicle | -0.08 | -0.17 to 0.01 |
A severity grade is a measurement with a particular meaning
The trial's primary fine-wrinkle outcome was a semiquantitative 0–9 rating. Semiquantitative means that numbers organize a judgment of severity. An ordinal scale establishes an order: a higher category represents greater severity. That ordering does not, by itself, establish that every adjacent step represents an identical visible difference. The number is a structured description, rather than a ruler measuring wrinkle depth or a tally of separate lines.
A useful mathematical check is to ask what changing the labels would do. Imagine replacing an ordered grading system's numerical labels with letters while preserving every category definition. The observations and their order would remain, but percentage calculations on the labels would no longer be possible. This shows why an arithmetic percentage change in a severity score cannot automatically become a percentage reduction in physical wrinkles. A numerical zero is not sufficient evidence of a ratio measurement.
Using a mean of numerical grades can still provide an informative summary. It makes the spacing between grades part of the interpretation, which readers can examine alongside the category definitions and distribution. The guide to reading wrinkle claims helps keep the advertised outcome attached to its actual unit.
Two invented groups show what averaging removes
Consider two entirely fictional cohorts of ten people each. Every person begins at severity score 4. In cohort A, everyone finishes at 3. In cohort B, five finish at 2 and five remain at 4. Both cohorts finish with a mean score of 3, giving both a mean change of −1. These are invented teaching values, not participants or observations from the retinol experiment.
The arithmetic is straightforward. Cohort A's final scores sum to 30 because ten people each contribute three. Cohort B also totals 30: five contributions of two plus five contributions of four. Dividing either total by ten returns the same answer. Averaging has preserved the overall numerical movement while discarding the arrangement of that movement among individuals.
Neither distribution is automatically preferable. Someone interested in a consistently small change might evaluate them differently from someone willing to accept no change for a possibility of a larger one. The average cannot settle that preference. A distribution, such as a count at each change category, would expose the distinction without requiring readers to reconstruct it from a representative photograph or an individual anecdote.
| Fictional cohort | Final scores | Mean change |
|---|---|---|
| A | Ten people at 3 | −1 point |
| B | Five people at 2; five at 4 | −1 point |
A responder percentage depends on the rule that creates it
Apply an arbitrary teaching rule to those fictional cohorts: count someone as a responder only after an improvement of at least two points. Cohort A then has 0/10 responders, while cohort B has 5/10. This threshold is invented, unvalidated, and unrelated to an actual response definition in the retinol study. It is not a recommended minimum clinically important difference. Its purpose is to show how the same mean can coexist with different responder counts.
Change the teaching threshold to at least one point and the ranking reverses: all ten in A qualify, compared with five in B. That reversal arises from the definition, not a change in anybody's outcome. A responder claim therefore needs its threshold, its timing, and its denominator attached. Reporting the percentage alone hides the decision that converted a spectrum of changes into a yes-or-no result.
For a real trial, a response definition chosen before examining outcomes is easier to assess than one selected afterward because it makes a result look impressive. The wrinkle-study headline guide provides a related way to examine the wording of a claim: identify the underlying comparison before treating a memorable number as its meaning.
Precision about a mean is different from variation among people
A confidence interval addresses uncertainty in an estimated group quantity. Under the assumptions of its statistical procedure, a 95% confidence method would produce intervals containing the true quantity in 95% of repeated samples. It is not a statement that 95% of individuals experience changes inside the displayed range. Nor does it assign a person a 95% chance of achieving the average result.
The fictional cohorts illustrate why these distinctions matter. One has identical changes, while the other has visibly different changes across people. If a much larger sample repeatedly displayed either pattern, the group mean could become quite precise without making the two patterns equivalent. Increasing the amount of information about an average does not necessarily eliminate heterogeneity, meaning variation in the outcomes contributing to that average.
When looking at an error bar, first identify its target. Is it uncertainty around a mean, a measure of the spread of observations, or a range intended to predict a future outcome? These are different statistical objects. A compact chart becomes more informative when its caption names the object and the underlying analysis, because the bar's visual width alone cannot tell readers which question it answers.
A paired comparison preserves each person's two observations
The randomized experiment compared laboratory 0.4% retinol with vehicle on protected upper-inner arms in adults averaging 87. In a paired design, the unit connecting the observations is the participant. The useful comparison asks how that person's two sides differ, then combines those differences across people. Counting the sides as unrelated people would discard the structure that makes the design informative.
For an invented illustration, imagine one person whose two changes are −2 and −1, and another whose changes are 0 and +1. Each within-person contrast is −1, despite the different absolute changes. Pairing retains that consistency. If observations were shuffled between people, the spread of calculated contrasts could change even though each side's collection of values stayed the same. This dependence is why correlation, or how paired measurements move together, affects uncertainty.
Consequently, subtracting the endpoints of two separate mean confidence intervals does not construct a valid confidence interval for their paired contrast. That calculation needs information about the paired differences. The companion tretinoin tissue-and-appearance analysis addresses a related reading habit: retain the identity of each measurement instead of combining numbers simply because they appear beside each other.
A detectable difference needs another bridge to personal importance
Statistical detection asks whether the observations are sufficiently inconsistent with a specified no-difference model, given the analysis assumptions. Personal importance asks whether the magnitude and nature of a change matter to someone experiencing it. More precise measurements can make a small difference detectable. They cannot, by themselves, decide whether that difference is noticeable, satisfying, or worth the burdens associated with obtaining it.
A participant-reported anchor could help build that bridge. Researchers might ask people to rate whether a change is noticeable and meaningful, then examine how those answers relate to changes on the investigator's scale. Such a study would need understandable questions, consistent timing, and an assessment of whether the anchor actually tracks the outcome of interest. A question about overall satisfaction could blend appearance with comfort, convenience, and expectations.
A planning assumption used to calculate statistical power is not automatically a validated threshold for meaningful improvement. Power concerns the chance of detecting a specified difference under a chosen model. An importance threshold needs a separate justification. The questions below suggest complementary analyses; they do not claim that a particular anchor or responder threshold has been validated for this experiment.
| Question | Information needed | Interpretation |
|---|---|---|
| What changed on average? | Mean change and its uncertainty | A group summary |
| How were changes distributed? | Counts across change categories | Variation among participants |
| Who met a response definition? | Prespecified threshold and denominator | A rule-dependent proportion |
| Did the change matter? | A suitable participant-reported anchor | Importance from the participant's perspective |
Missing observations change the construction of the estimate
The intention-to-treat table includes 36 using last observation carried forward; the completer figure includes 23 with standard errors. Thirteen withdrew, including three for irritation/pruritus. Carrying an observation forward means assigning an earlier observed value to a later analysis point. It preserves a record's presence in the calculation, but does not transform the assigned value into a measurement made at that later visit.
Consider a general example in which someone improves early and then leaves a study. Holding their last score fixed assumes no subsequent change for that calculation. Continued improvement, loss of improvement, and worsening would yield different final results if they were actually observed. The direction of any distortion depends on what happened after observation stopped; carrying values forward is not inherently conservative in every setting.
A useful sensitivity analysis asks how conclusions change under other plausible assumptions about missing outcomes. It is also important to examine why observations stopped, because tolerability and unrelated life events answer different questions. Our guide to a manageable routine offers practical context for considering burden. That context should remain separate from the statistical assumption used to fill an observation gap.
Benefit and burden should be read together without collapsing them
A lower severity score and an uncomfortable experience can occur in the same person. Conversely, a comfortable experience can accompany little measured change. A single average appearance score cannot reveal either combination. To understand that relationship, a study would need to connect benefit and adverse experiences at the participant level while protecting privacy, rather than placing unrelated group summaries beside each other and assuming they describe the same individuals.
One possible presentation would cross-classify improvement categories with symptom severity and whether participation continued. That would show how outcomes overlap, while retaining uncertainty where groups are small. It would not justify subtracting a symptom score from a wrinkle score: the two scales may have different units and different meanings. Readers also vary in how they value comfort and appearance, so a universal arithmetic tradeoff would require strong additional justification.
The hydration and wrinkles guide helps frame distinct expectations for a product. For a separate documentary check, the Agency review can be used to examine purchase terms. This is an editorial distinction between evaluating evidence and evaluating an agreement; a contract description supplies no measurement of clinical benefit or tolerability.
Another study can broaden the question without supplying a conversion factor
The concentration-comparison abstract reports similar facial improvement but greater irritation at the higher strength; its histologic percentages are not wrinkle reductions. The two-year tretinoin abstract reports favorable facial outcomes; the accessible acknowledgment documents OrthoNeutrogena support and author financial relationships. Full methods and results were unavailable for both comparisons. These records can inform questions about measurement and interpretation without becoming interchangeable estimates.
The official RENOVA label concerns a specific 0.02% tretinoin cream and adjunctive fine-facial-wrinkle use. Its response categories cannot define responders in another experiment. Similar terminology does not establish shared category boundaries, identical observers, or equal spacing between grades. Combining results would require a defensible relationship between the instruments and study conditions, rather than a conversion based only on their numerical ranges.
For an individual expectation, the relevant chain also includes the body area, formulation, comparison treatment, and population. Evidence at one link does not fill every other link. The retinol-or-prescription guide can help organize those distinct questions. The appropriate conclusion may be that a study answers a narrow question well while leaving a proposed facial-product comparison unresolved.
An auditable interpretation keeps decisions visible
Four investigators disclosed conditional patent royalties, which do not establish payments or sponsorship. That disclosure belongs beside the interpretation, but it cannot substitute for examining the measurement and analysis. A financial interest does not prove a result false; an appealing numerical result does not make the interest irrelevant. Both the disclosed relationship and the evidence supporting a claim should remain visible to the reader.
For future research, an auditable analysis would specify the scale, primary comparison, response definition, missing-data strategy, and participant-important anchor before outcomes are examined. Reporting the distribution alongside the mean would help readers see what the average compresses. Showing how conclusions behave under reasonable alternative assumptions would identify which decisions matter most, without pretending that every possible reanalysis has equal scientific merit.
An editorial record can preserve the same discipline: separate observed quantities, analytical choices, and personal priorities. If the next question concerns purchasing rather than measurement, the Musely review offers a place to check documentary terms. That review link does not extend experimental results to a provider. The reader should be able to follow a claim back to its actual measurement without passing through an untested promise about their own outcome.
Questions about the evidence
Does a one-point improvement mean one fewer wrinkle?
No. A severity grade describes a category or level on an assessment scale. A change in that grade is not a count of lines disappearing. Converting between the two would require evidence linking the grading system to physical wrinkle counts, with a clearly defined counting method.
Can the mean tell me the chance that I will respond?
No. A response probability needs a response definition and information about the distribution of outcomes in a relevant population. An average can arise from many different distributions. Even a well-defined observed responder proportion carries uncertainty and does not guarantee the same probability for someone in a different setting.
Are means inappropriate for all ordered ratings?
No. A mean may be a useful summary when its numerical interpretation is understood. The important questions are how categories were defined, what their spacing implies, and whether other summaries support the conclusion. A distribution or sensitivity analysis can add information without dismissing the original statistical analysis solely because it used grades.
Would a responder analysis settle whether a treatment is worthwhile?
It would answer a more specific question, but its usefulness depends on a justified threshold and an appropriate denominator. Whether the outcome is worthwhile also depends on participant priorities, discomfort, and burden. A clinically important threshold needs evidence of meaning, not simply a convenient whole number on a scale.
Why examine a study's financial disclosure separately from its results?
Disclosure identifies interests that readers should consider; methods and results show how a claim was produced. Neither can replace the other. A useful appraisal keeps both visible, checks the documented relationship precisely, and avoids inferring an undisclosed payment or declaring a result invalid from an affiliation alone.
Editorial assessment
A strong reading of a wrinkle study preserves the unit, the comparator, and the population behind each number. It then asks what additional information is needed for the next question: a distribution for variation, a justified threshold for responders, an anchor for personal importance, and appropriate observations for benefit alongside burden. Keeping those questions distinct makes a positive result interpretable without turning its average into a prediction for every reader.
Research access and limitations
The fictional cohorts and responder rules are teaching examples, not clinical observations or validated decision thresholds. This methodological analysis provides no individual regimen, strength selection, treatment duration, or product-outcome prediction.
Sources and access notes
- Improvement of naturally aged skin with vitamin A (retinol).
Full publisher research article, including original clinical table-image footnote, figure captions, Comment and Financial Disclosure; no supplements or individual data reviewed. · Checked October 21, 2026
- DailyMed - RENOVA- tretinoin cream
Official current labeling retrieved in full · Checked October 21, 2026
- Two concentrations of topical tretinoin (retinoic acid) cause similar improvement of photoaging but different degrees of irritation. A double-blind, vehicle-controlled comparison of 0.1% and 0.025% tretinoin creams.
Indexed original research abstract · Checked October 21, 2026
- Long-term efficacy and safety of tretinoin emollient cream 0.05% in the treatment of photodamaged facial skin: a two-year, randomized, placebo-controlled trial.
Indexed original research abstract plus publisher acknowledgment and financial disclosures; full methods and results not reviewed. · Checked October 22, 2026